Product Overview
This product allows users to interactively design a tabular expression. The resusulting function can be saved as a Simulink block or to a Matlab m-file. Tabular Expressions can be proved to be disjoint and complete using the PVS theorem prover. This allows users to ensure that the table they are designing has covered all possible inputs and is deterministic.
Contents
Creating a new table
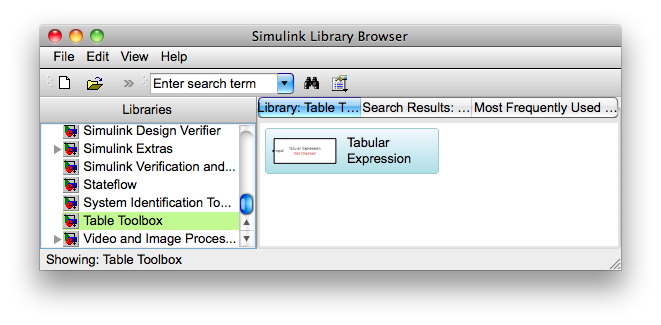
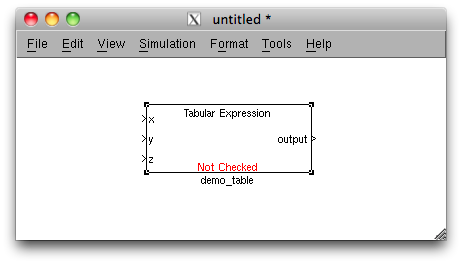
To create a new table block locate the Tabular Expression block in the simulink library.
Drag the Tabular Expression block to a new or existing model.
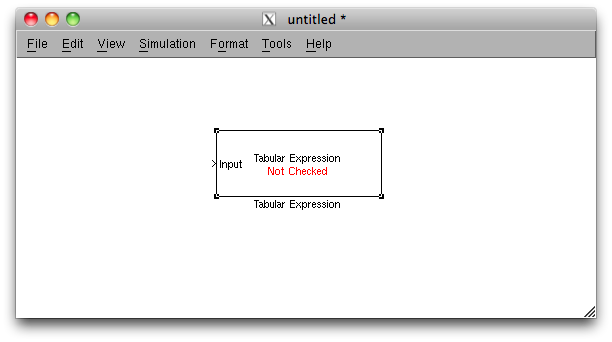
Table Tool Dialog
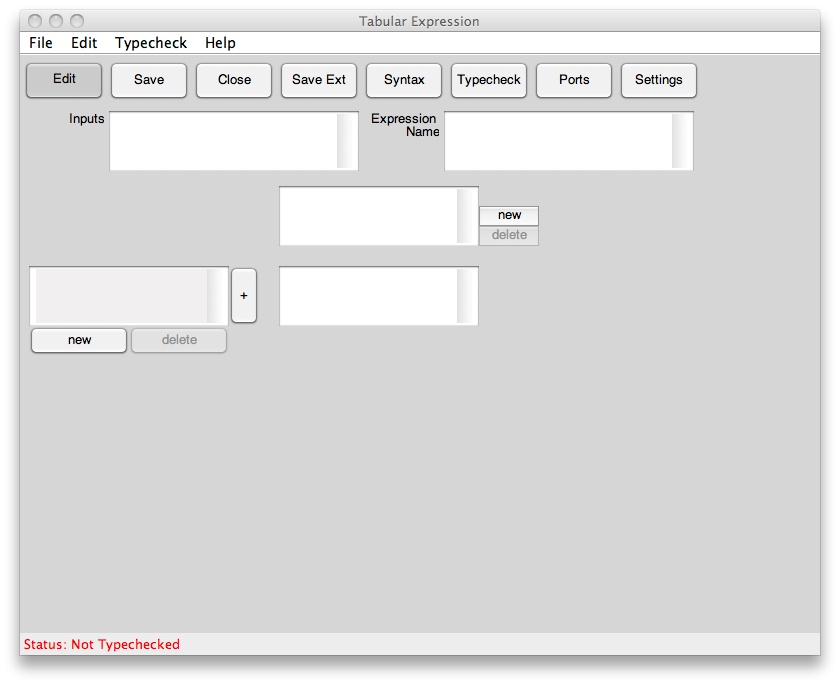
To edit the functionality of the table double click on the block to bring up the Table Tool dialog. From this dialog you can create the layout for the table and edit the conditions and outputs for the function.
Example Table
An example of a 2-dimensional table is shown below
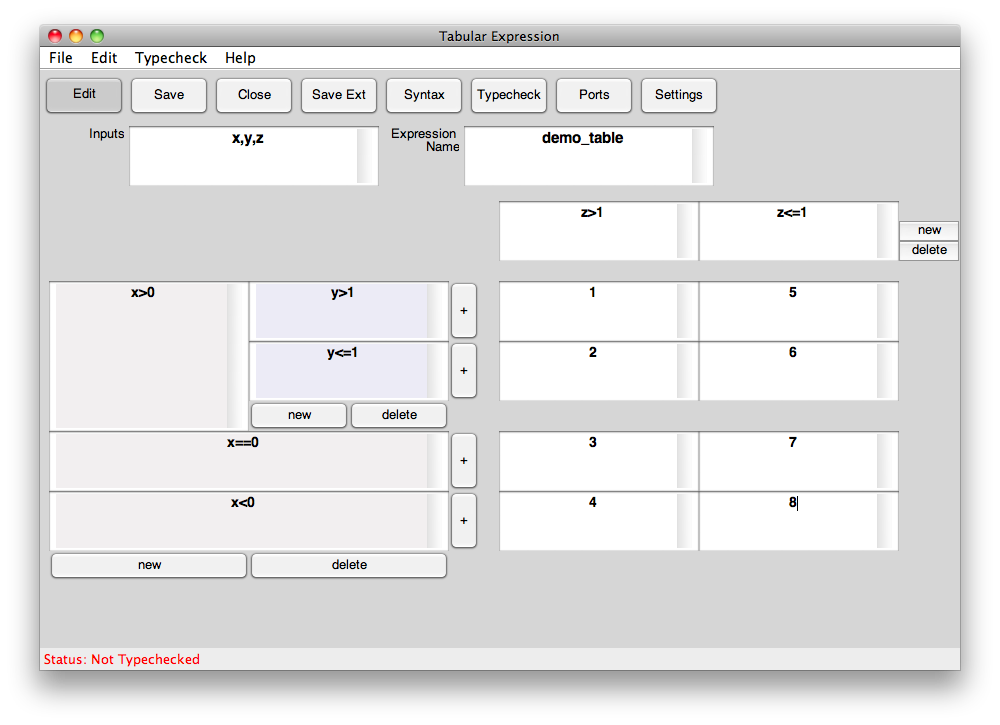
This table specifies a function with 3 inputs x, y, and z, and one output. Saving the table will generate the following embedded matlab code:
function output = demo_table(x,y,z)
%%#eml
if(x>0)
  if(y>1)
    if(z>1)
      output = 1;
    elseif(z<=1)
      output = 5;
    end
  elseif(y<=1)
    if(z>1)
      output = 2;
    elseif(z<=1)
      output = 6;
    end
  end
elseif(x==0)
  if(z>1)
    output = 3;
  elseif(z<=1)
    output = 7;
  end
elseif(x<0)
  if(z>1)
    output = 4;
  elseif(z<=1)
    output = 8;
  end
end
Input argument "x" is undefined.

Error in ==> TT_gs_over at 35
if(x>0)
If we go back and look at our model window we can see that our Tabular Expression block has updated based on our specified inputs and outputs.
Proving a Table
Let us assume that a table designer has specified the following function table:
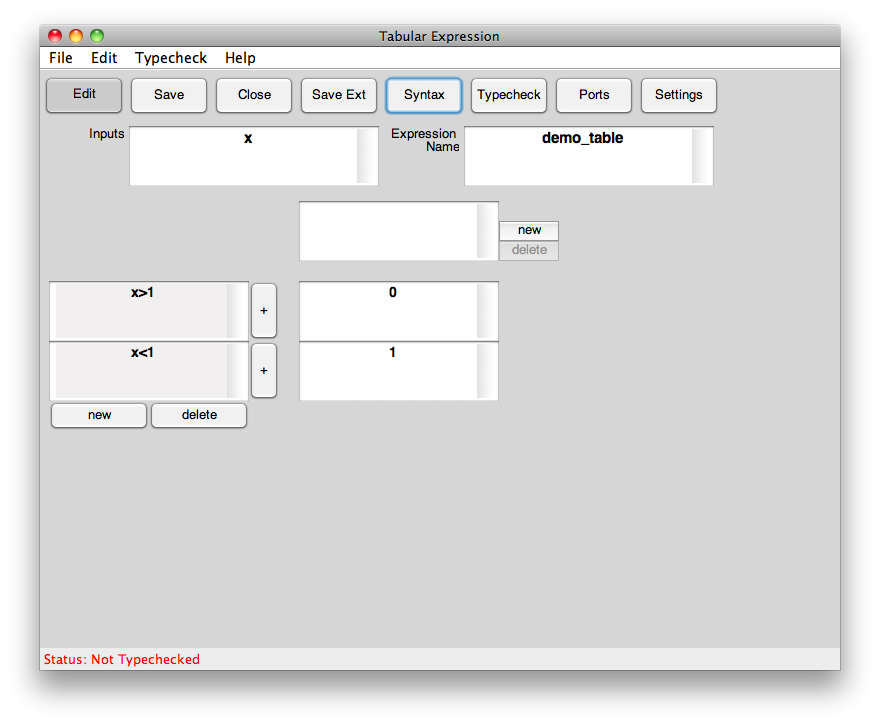
In order for a tabular expression to be considered "proper" it must satisfy a Completness and Disjointness condition
- Completness means that in the specification of a function we have considered all possible inputs in a condition cell.
- Disjointness means that in the specification of a function all condition cells in a grid are pairwise disjoint, in other words for all possible inputs it is not the case that two conditions are true at the same time.
We desire these properties to ensure that our function is total and is deterministic. A function that is not total or not deterministic can have undesired effects, potentially causing safety critical problems depending on the requirements of the software. The graphical layout of a table helps the designer to evaluate a table for these conditions. Some times it is a non-trivial problem to determine if these conditions have been meet, so we employ the use of a theorem proving software to mechanically prove the properties.
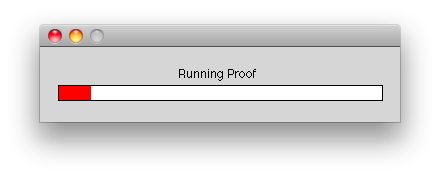
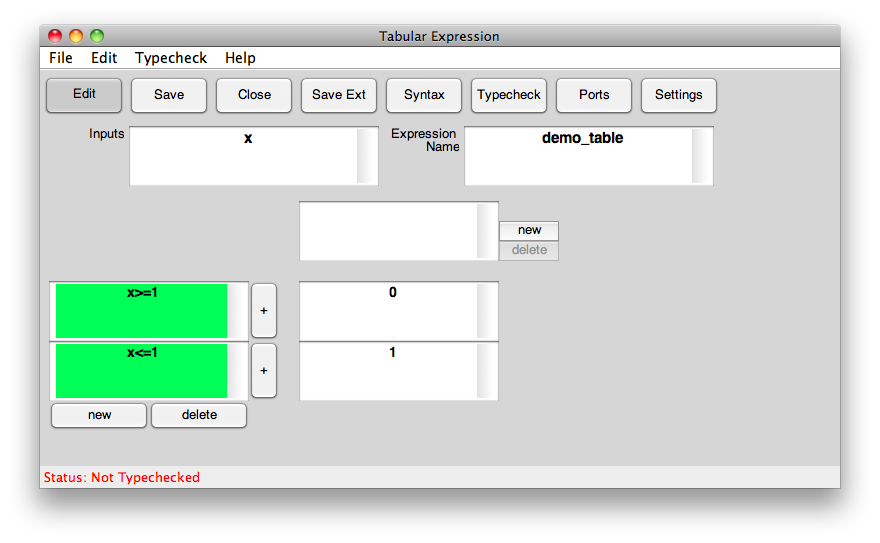
Consider our example table, the designer of this table has failed to consider the case when x is equal to 1, the completness condition is not satisfied. Clicking on the Typecheck button will start the proof and popup a process dialog as shown below:
If the proof fails it will pop up a dialog giving the user some feedback of why the proof failed as seen in the next image.
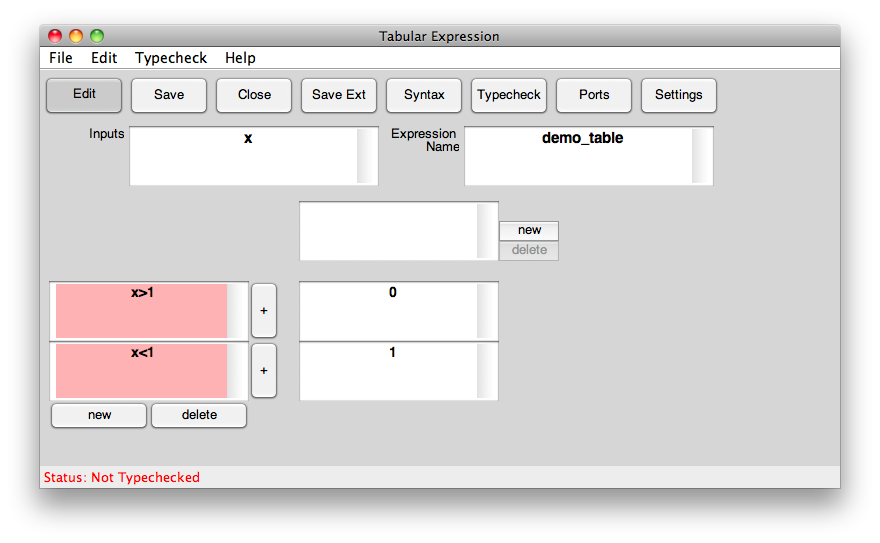
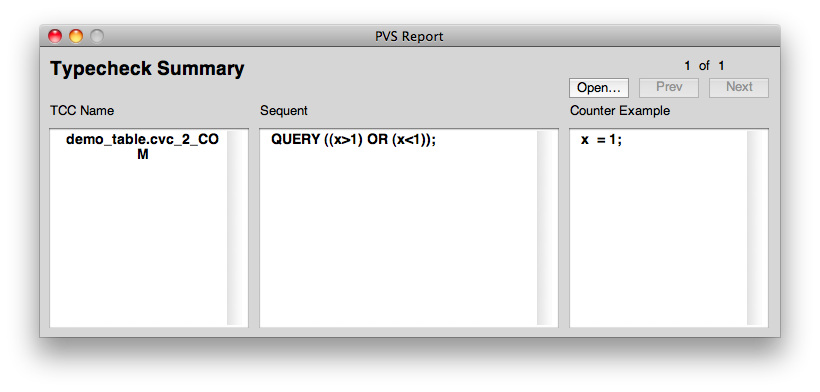
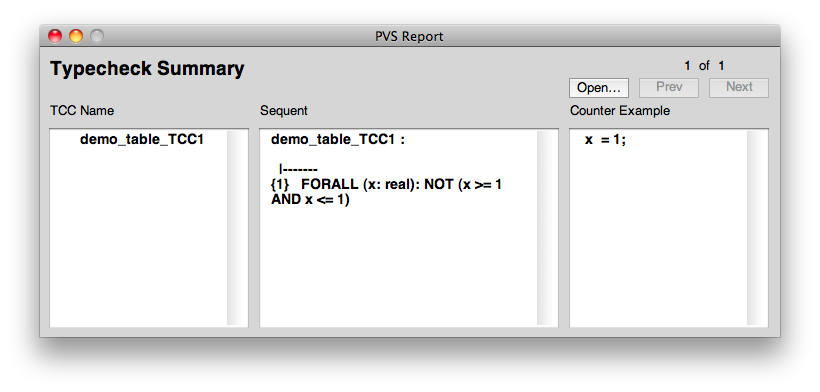
The Typecheck summary window will display the formula for which a proof was not found. If a proof fails PVS attempts to find a counter example. In this senario pvs has found that a counter example to the formula is x = 1. When a counter example is found the tool will give visual feedback on which conditions were true and which were false for that counter example. A condition coloured red indicates that the condition was false for the given counter example, a green colour indicates that a condition is true. For this example we can see that both possible conditions are false for the counter example indicating to the table designer that they failed to consider a case of the input.
In the example above, the designer of the table has captured the case where x = 0 in both conditions of the table. The tool has highlighted both cells green to indicate to the user that for the counter example of x = 0 both of these conditions are true, the designer has failed to unambiguosly specify what should happen in this senario.